

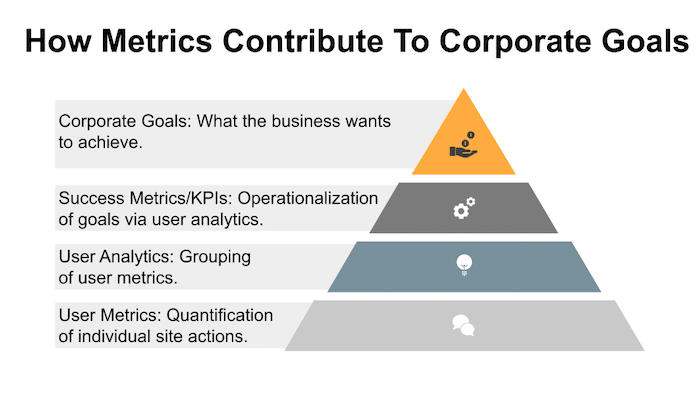
In product management, user metrics are what you will live and die by, so you should probably have a basic understanding of them. Terms like user metrics and user analytics get bandied about interchangeably and can be quite confusing to the neophyte product manager, so lets break things down about. There are really 4 concepts at play when you want to get your head around product management and user metrics, each building upon the other as depicted in the diagram below
For the sake of completeness, let’s start the top of the corporate goal pyramid, work our way down, and then back up again, s by the time we are done you will either:
- Understand how all the pieces fit together, or
- Staring at your favorite porn politics sign, in utter boredom. It’s a 50/50 chance, but I am willing to risk it, so lets get moving.
Corporate Goals: These are the objectives the company sets for itself. Typically, corporate goals are higher level goals like:
- Competitive Differentiation
- Customer Delight
- Technical Improvements
- Product Features
- Improve Customer Satisfaction
- Increase Lifetime Value
- Upsell New Services
- Reduce Churn
- Expand Geographically
- Mobile Adoption
Success Metrics/KPIs: These are the quantitative measures by which the company will measure its progress in achieving the corporate goals. As defined elsewhere, success metrics are an important part of tying the product roadmap to the corporate strategy.
User Analytics: User analytics tell you the “story of your product” by assembling user metrics in such a way that it provides you with meaningful information about the performance of various aspects of your product, like the:
- Sign up process
- Path the purchase
Aggregated user analytics, are useful for several reasons.
- They can reveal a problem on one specific section that you might not find manually.
- Allow you to trend data over time, so you can measure current performance against historical norms, which is pretty fundamental to your job.
User Metrics: The statics associated with different actions on your site. So if you have your user analytics set up to track the efficiency of your sign up funnel, the user metrics are the various button clicks, swipes and text entries along the way. If you really need it spelled out for you, this should help you figure out what is a “metric” in Google Analytics.
From a terminology point of view, user metrics are often confused with success metrics and key performance indicators (KPIs), what while in some cases specific user metrics can also be a success metric or KPI, the reality is that user metrics are low level and roll up in user analytics and then to to the calculation of success metrics/KPIs.
In the discipline of product management, user metrics are how you monitor the performance of your product and by “monitor the performance of your product”, we mean how you go about keeping your job.
Product Management And User Metrics: Like Peanut Butter and Jam

Which User Metrics Are Used in Product Management?
The short answer to that question is “The contextually meaningful ones”.
Our job as a product manager is to figure out which user metrics to assemble into meaningful user analytics, so that we accurately measure the component tasks associated with the larger actions that we want users to successfully complete.
So, at the risk of being repetitive, metrics are things like traffic, specific button clicks, page views, etc, things that in and of themselves do not really mean much without context. You give them context by associating them with larger goals.
Feeling a little lost?
Well, to be honest, I thought you looked a little slow on the uptake, so I put together a small scenario for you to work through so things don’t seem so abstract.
First things first. Whether you are working on your own product, or in a larger organization, user metrics are never going to be used on their own and are never going to be where you start this exercise. Someone, maybe you or maybe your boss, is going to have some high level goals, which in this case is going to be “Attract more users”
Corporate Goal: Attract more users
Now against this goal, you have to figure out, what is a “reasonable” way to measure your success at attracting more users. It could be as something as simple as generating more inbound traffic, but that is more of a marketing/content issue. As a product manager you would probably look at something like new user sign ups a good success metric
KPI: Growth in new user signups
So now that we have a KPI, we need to gather some baseline performance numbers so we know what we are starting with as a baseline.
And now we have to take a bit of a detour, and by detour I mean as a product manager, you need understand conversion funnels and how to work with them, so please hop over and read Product Manager Metrics, so I don’t need to copy the same words in this article.
After reading that article, you should come to the conclusion, that the world, well at least the product management world is a little like the movie “Inception”, in that web products are simply a series of conversion funnels within conversion funnels and every process you are going to optimize within a product is simply going to be streamlining the transition from one stage of the funnel to the next.

User Analytics: At this point in the process there is going to be a bit of interplay between user analytics and user metrics to make sure the user analytics are collecting the right metrics in order to reflect our success metrics. Analytics give metrics context, allowing you to discover insights about what to do next.
Continuing along with the KPI of generating growth in new user signups in order to satisfy the corporate goal of “Attract More Users”, you need to make sure that your user analytics capturing all the data from the various phases of the “user sign up” funnel. In order to do this, you need to outline the steps in the funnel and then determine the metrics that track a users transition from stage to stage in the funnel.
For a deeper dive on the hairsplitting of user analytics from user metrics, give our article, Product Management and User Analytics a read.
User Metrics: Much like DNA is the fundamental building block of life, user metrics serve as the foundation of almost everything you will do in product management. In product management, user metrics (aka “data points”) must be assembled in such a way that they create a meaningful story and in order to answer questions related to the product hypothesis (Article Link: How Do Product Managers Validate A Product Hypothesis)?
You use metrics to monitor what users are doing at each of the identified steps along the funnel you are looking to improve the efficiency of.
And now we are going to show you how.
How to Figure out the Right User Metrics in Product Management
So let’s operationalize some user metrics shall we. While the specific part of the funnel you focus on depends on the overall goal you are pursuing, but the general process when starting an optimization process is to start at the top of the funnel and work your way down, as this will probably give you the biggest bang for your buck when doing the Product Finance Dance.
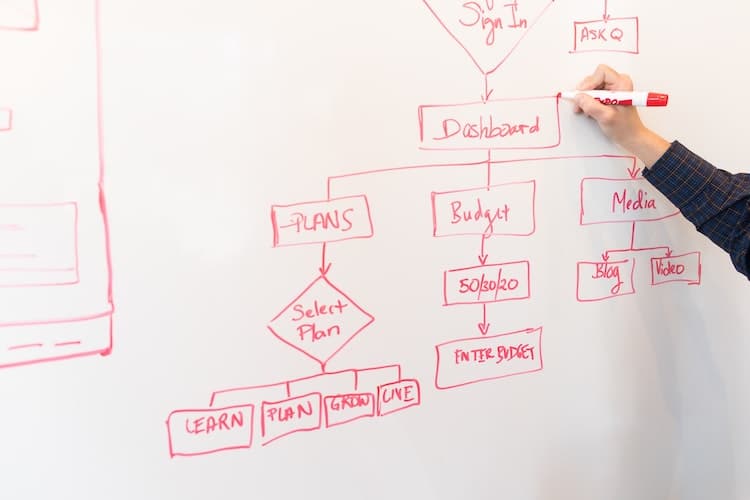
Step 1: Build yourself a flow chart of the process to break the funnel you are looking to optimize in to distinct steps. So continuing on with the goal to grow user sign ups, a reasonable course of action would be to break down the sign up process into its component steps to explicitly state the actions we want a user to take in order to sign up. It might look something like the image below. Please note, that for the sake of brevity, we have greatly simplified this process. The reality is that each of these items on the chart consist of lower level process funnels that you can optimize over time.

- Number of users that hit the page
- Percentage of users that register without Facebook
- Percentage of page visitors that fill out each of the fields
- Percentage of page visitors who click the submit button
Based on metrics, we see a large drop off in the sign up process between the fourth and fifth fields. If remove the fifth field, we might boost user sign ups.Put together sign up metrics together, and the user analytics will give you a sense of what’s going on with the sign up process and user acquisition Read our article on product management and user analytics to dive deeper into the analytic end of things
Managing User Metrics
Although a lot of the products on the market will come with prefab reports for you, as a product manager, you should have an understanding of how these items get grouped together to spot trends within user analytics:
Funnels: Which we alluded to above and in Product Manager Metrics. The take away is that there three subsection sections, smaller funnels if you will, within your site’s main funnel where you can look for optimization opportunities:
- TOFU: Top Of funnel
- MOFU: Middle of funnel
- BOFU: Bottom of funnel
Segmentation: It is a well known phenomenon that lots of information gets lost when you aggregate data. Segmenting data along any number of dimensions (technology/language/geography/etc) allows you to explore data deeper to discover relationships and meaningful behavior patterns hidden by higher level views.
Cohort Analysis:
A cohort, on the other hand, is a slightly more narrow group of customers having the same characteristic and usually includes time-sensitive grouping. For example, customers who shop on Boxing Day. Although it sounds similar to segmentation, but it uses a point in time as a key characteristic of the group and looks at behavior over time.
When using user metrics, you should be looking at your funnels with either the lens of segmentation or cohort analysis. Every transition point on your process chart is an opportunity to improve your performance