

Normally, I would lambaste you for asking something like ‘What does the “users” metric measure?’, but my therapist says being nicer to people is good for my health, so I figured I’d give it a shot.
Before diving in, make sure you read the article below to get an entry level of understanding in order to give you some context:
- The total number of visits to your website.
- Users that had at least one session on your site in the given date range
- Users that visited the homepage of your website
- Users who have registered on you site
- The first time a person visits your site, a Google Analytics (GA) cookie get set, assigning a unique identifier to them and distinguishing the person as a “new user”.
- When the same user visits your site at a later time, they will be counted as a “returning user”.
Now that we have gotten the perfunctory out of the way, let’s dive in a little deeper shall we?
How Do Analytics Packages Identify Users?
Google Universal Analytics
User Metric Pre September 2016
The Users and Active Users metrics show how many users viewed your application and Google Analytics (GA) uses different techniques for calculating Users for different report requests.
This means you may find discrepancies in Users/Active Users metrics in different reports due to the fact that User calculations are more difficult than the simple adding/subtracting as GA must recalculate Users for each date range that you select in a report to eliminate and double counting
When generating reports GA creates unsampled, aggregated data tables, that it updates on a daily basis. So when a report is requested, GA looks up each metric in the pre-aggregated data tables and serves those results to your reports.
This works well for simple additive counts over days. However, “Users” is based on more complicated calculations to avoid double counting; it not just summing the the value of Users you see in reports because this number is based on a complicated calculation. As a result it is not just added to the running total in the pre-aggregated data tables, but rather the metric is recalculated on each time you request it.
To address this challenge, different styles of reports use different calculations methods. are one of two calculations used for Users depending on the report being viewed.
Single Dimensional Time Based Reports
These reports use pre-calculated data (“un-sampled data”) based on:
- The number of sessions in the given date range
- The time of each session based on the device (“client-side time”).
The result of this calculation gets added to the pre-aggregated data tables so GA reference the table to quickly retrieve and serve this data in reports when the only dimension is a time frame, like the Date, Week of Year, or Month of Year, so you only see it in:
- The Audience Overview report when no Segments are applied,
- Custom report where one of these date dimensions is the only applied dimension.
Although this calculation can quickly deliver un-sampled data, since it relies on number of sessions and client-side time, it can be inconsistent if:
- A user’s client-side time is incorrect.
- You use a reporting view that filters out some sessions from a user.
In order to avoid potential inaccuracies, you can force GA to use a real time “User” calculation by create a custom report with a non-date dimension that will be the same across sessions for users (e.g., Browser, Operating System, or Mobile Device). This
Non-Time Dimension Reports
When viewing reports with any non-time (or date) dimension, GA calculates “Users” on the fly, usually via cookies managed via a web browser. This calculation is used in custom reports and allows for the calculation of “Users” over any dimension, like Browser, City, or Source.
As this requires a large amount of computation using large data sets, including the raw session tables, it requires more time than to process and serve data to your reports because. Another point to note is that if the involved data sets are large enough, it induces sampling,
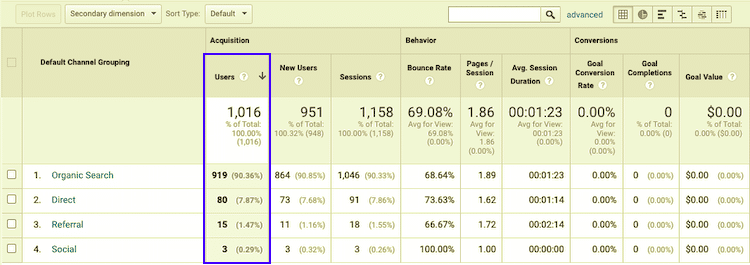
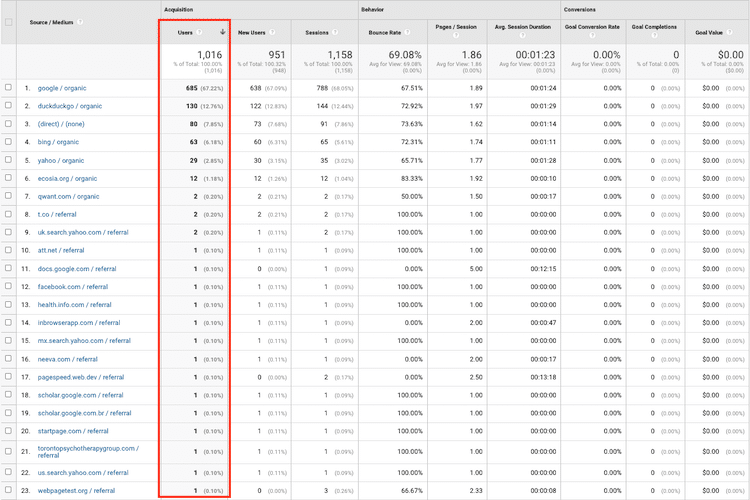
Note that for some dimensions, like Source or Medium, the same unique user can be in multiple buckets (for example, if a user visits from organic search and paid search in the same date range). For this reason, when viewing Users over such a dimension, the sum of the rows may not add up to the total, as seen in the image below.
User Metric Post September 2016
GA started to use a single, first-party cookie named “_ga” that stores a client ID to determine which traffic belongs to which user by associating a unique identifier with each user.
By early 2017, GA modified the calculation for the Users/Active Users metrics to count users with high accuracy and low error rate . The “New Users” calculation uses the pre September 2016 method.
How Google Analytics Might Double Count Users
- Accessing a site on the same device but with a different browser:
- A new unique identifier is issued for each browser.
- Using different devices in different locations:
- If a user visits a site through a work laptop, they get cookied, assigned a unique identifier, and counted as a new user.
- If they then fake sick, head home and then visit the same site again on their home computer, that computer gets a new cookie and new unique identifier.
- They will also be counted as 2 new user by GA user .
- When user clears their cookies and re-visits a site with the same machine and browser, they get counted as a new user.
Why don't the user metrics add up over multiple days?
If you really want to know ‘What Does The “Users” Metric Measure?’, you should be able to account for why individual days user counts don’t add up to the weekly or monthly total?
The reason is that same user can come to your site multiple days.
Let’s say you User A and B came on Monday, so Monday will show you two users.
Now on Tuesday User A comes back again to the site, so Tuesday shows you 1 user on the site.
When you look at Monday to Tuesday range, you will only see 2 users, not 3 users because during last 2 days there were only 2 unique users.